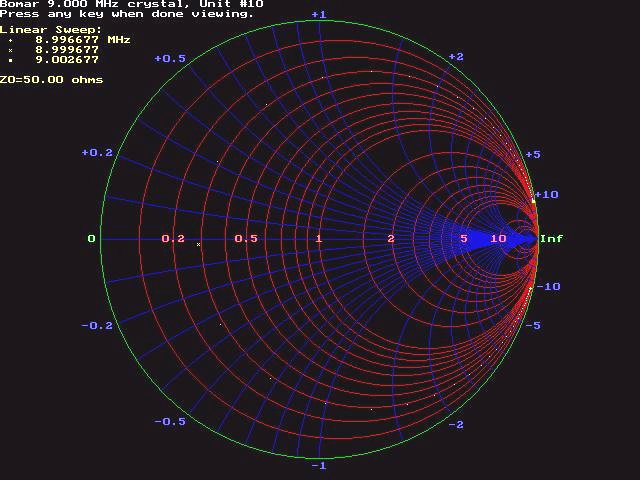
This is a Smith Chart of a 9 MHz quartz crystal, in 100 Hz steps
over a +/- 3 kHz range, nearly centered on the crystal's series
resonant frequency. This plot shows that the impedance of a crystal,
near series resonance, can be essentially modelled as a series RLC
circuit. This model loses accuracy as the parallel resonant frequency
is approached, which is dominated by a capacitance that shunts the
series RLC network.
Series resonance for this crystal is also seen to be approximately
320 Hz below 9 MHz and the series R is approximately 14 ohms.
Additional analysis of this data and measurements can be used to
fully characterize the equivalent circuit model for this
crystal. |